

Deportation Calculator: Did the Left’s Own Numbers Backfire?
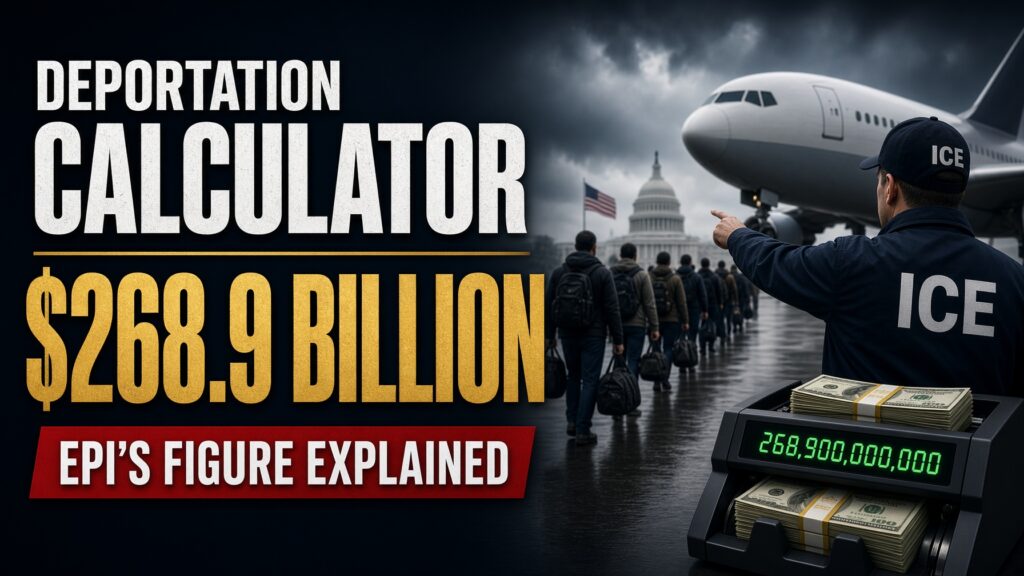
A left-leaning think tank built a tool to show taxpayers what immigration enforcement costs. Now Americans are asking the question it left off the screen: what does the status quo cost?
One number was supposed to end the argument.
In August 2026, the Economic Policy Institute (EPI), a left-leaning think tank, released a Cost of Deportations Calculator. Visitors enter a state, county, or city and see their share of federal deportation spending. The nationwide total is $268.9 billion through the end of President Trump’s term, or about $2,358 per taxpayer [EPI; figures compiled by the National Priorities Project]. The tool was meant to alarm. A ledger with only one column, though, is not an audit.
Support Independent Local Journalism
TheTownHall.News is a non-profit reader-supported journalism. Just $5 helps us hire local reporters, investigate important issues, and hold public officials accountable across Alameda County. If you believe our community deserves strong, independent journalism, please consider donating $5 today to support our work.What Does the Deportation Calculator Actually Say?
It says what it was built to say. The $268.9 billion estimate blends money from the 2025 budget law known as the One Big Beautiful Bill Act, regular appropriations, and repurposed funds [Axios reporting on EPI data]. EPI then translates the total into local terms. Kansas taxpayers, for example, would each pay roughly $1,800, and the same money nationally could fund more than 925,000 teachers or public housing for 9.7 million households [Axios].
Those comparisons are vivid, and the arithmetic is easy to check. EPI’s own FAQ is more revealing. It asks whether deportation might save taxpayers money and dismisses the idea, arguing that unauthorized immigrants pay close to $100 billion a year in taxes [EPI]. The institute is entitled to that view. But a view is not a measurement, and the calculator offers no figure at all for the other side of the ledger.
Why Is the Calculator Only Showing Half the Ledger?
Because the other half is large and contested. The Federation for American Immigration Reform (FAIR), a group that favors lower immigration, estimated in 2023 that illegal immigration costs taxpayers $182 billion a year gross. After roughly $31 billion in taxes paid by unauthorized immigrants, that leaves $150.7 billion net [FAIR study, 2023].
$150.7 billion a year. If that estimate is anywhere near right, why does a tool built to total taxpayer costs leave it off the screen?

The roughly $700 billion figure circulating among enforcement supporters is an extrapolation of this kind. It is not an EPI or government calculation. Over the roughly 2.5 years left in this term, the same FAIR estimate works out to about $375 billion [author calculation from FAIR estimate]. That is still higher than the calculator’s total, and the calculator never mentions it.
A calculator built to make taxpayers wince at the price of enforcement never showed them the price of looking away.
How Much Does Self-Deportation Change the Math?
Enforcement is not one price. DHS told Axios in July that a non-voluntary deportation costs about $18,000 per person [DHS statement via Axios]. A person who leaves through the CBP Home app receives a free flight and a $2,600 stipend, which DHS says brings the cost to about $5,100 and saves taxpayers roughly $13,000 per person [DHS statement via Axios].
$5,100 versus $18,000. That is the gap DHS says separates a voluntary departure from a forced removal, so why isn’t it anywhere in the calculator’s framing?
DHS also claims that 2.2 million people have self-deported since January 2025 [DHS claim, disputed]. Treat that number carefully. Brookings has said DHS’s figures “should not be considered a serious source,” and reporters have noted that DHS has not explained its method [Brookings; CNN]. Program-level counts are far smaller: a document reviewed by CNN showed nearly 72,000 departures through the stipend program. The honest takeaway is narrower but still useful. Voluntary departure is cheaper per person, and the calculator ignores it.
Support Independent Local Journalism
TheTownHall.News is a non-profit reader-supported journalism. Just $5 helps us hire local reporters, investigate important issues, and hold public officials accountable across Alameda County. If you believe our community deserves strong, independent journalism, please consider donating $5 today to support our work.Can Either Side’s Numbers Be Taken at Face Value?
No, and that is the point. The Cato Institute, a libertarian think tank, has criticized FAIR’s analysis for counting the U.S.-born children of unauthorized immigrants as a cost [Cato Institute via Nexstar]. EPI’s tax-contribution figure, meanwhile, comes from an advocacy organization that opposes mass deportation. Each side’s estimate rests on assumptions chosen by people with a stake in the outcome.
Is a number a fact just because it fits on a chart?
Fiscal accountability should cut both ways. Conservatives who demand scrutiny of every federal dollar, including the $268.9 billion spent on enforcement, should apply the same standard to the costs of non-enforcement. A one-sided tool is an argument. It becomes an audit only when someone totals both columns.
What Do Supporters of This Policy Actually Believe?
Critics of mass deportation, and the calculator’s supporters, make a serious case. Public money is finite, they say, so every dollar spent on detention and flights is a dollar not spent on schools, health care, or housing. They add that unauthorized workers pay payroll and sales taxes, so removing them shrinks the tax base and slows growth. And the spending is real, federal, and likely to grow if Congress appropriates more [Axios].
Those points deserve a straight answer. Opportunity cost is a legitimate principle, and $268.9 billion should face tough questions from every taxpayer, including those who support enforcement. But the argument has gaps. Opportunity cost applies equally to the recurring costs FAIR attributes to unlawful presence, such as schooling, health care, and criminal justice. Much enforcement spending is also one-time capacity, like detention beds and aircraft. And the cheaper voluntary route DHS describes would lower the per-person price over time.
Supporters of enforcement also argue that law and order has value beyond any spreadsheet. Immigration rules that go unenforced invite more violations. That is a principled position, and it should not be dismissed as merely fiscal.
None of this proves that the final net number favors enforcement. It shows that no one has produced a credible full accounting, including EPI.
Who Should Be Counting the Whole Cost?
Taxpayers should not have to rely on advocacy groups for the answer. Congress funds this spending, and Congress can require a complete, nonpartisan cost estimate of both enforcement and non-enforcement. The Congressional Budget Office and the Government Accountability Office already do this kind of work on other programs.
If every dollar of government spending deserves scrutiny, why should the cost of not enforcing the law get a free pass?
An honest ledger might cut against enforcement in some places and for it in others. Voters are entitled to see it either way, and a tool that shows only one column does not tell them.
Key Questions This Story Raises:
- Why does a calculator built to total taxpayer costs include enforcement spending but not the estimated costs of unlawful presence?
- If voluntary departure costs about $5,100 per person versus $18,000 for forced removal, should that difference shape how Congress funds enforcement?
- Who will produce a nonpartisan, full-ledger estimate that both sides will accept?
The Question Behind the Calculator
EPI set out to make Americans ask what enforcement costs, and that is a fair question. The calculator’s real contribution may be the one it did not intend, which is that taxpayers now want the whole ledger. The $268.9 billion deserves scrutiny, and so does every estimate of what the alternative costs.
What do you think: should Congress require a full cost estimate of both enforcement and non-enforcement? Share this article and tell us where you stand.
The real question isn’t what the calculator says. It’s what it was never designed to show.
Still Have Questions? Here’s How to Get Involved
Still have questions about where your tax dollars go? Stay informed: subscribe for daily coverage of federal spending and accountability.
Think others need to see the full picture? Share this article with your community.
Want your voice to count? Contact your member of Congress and ask them to request a nonpartisan CBO or GAO analysis covering both the cost of immigration enforcement and the cost of non-enforcement. You can find your representative at house.gov.